Why River Velocity and Water Level Should Be Monitored Together: An Engineering Guide
Learn why joint river velocity and water-level monitoring improves situational awareness, including deployment, data quality, alert design, and operational limits.
Why River Velocity and Water Level Should Be Monitored Together: An Engineering Guide
A river-monitoring station is often described in terms of a single number: its level, its velocity, or sometimes its calculated discharge. That shorthand is convenient, but it can hide the engineering context behind the number. Water level indicates where the water surface is relative to an agreed reference. Velocity describes how water is moving at a specified observation area and time window. Both measurements are valuable; neither by itself explains every condition that matters to flood warning, drainage operations, irrigation, bridge and culvert inspection, or river management.
Joint monitoring does not mean placing two unrelated traces on one dashboard. It means designing a traceable measurement chain in which the station location, hydraulic context, time base, quality flags, installation geometry, and response process are known. When those foundations are in place, the relationship between level and velocity can provide much stronger situational awareness than either signal alone.
The distinct question answered by each measurement
Water level is normally expressed as elevation above a local datum or as distance from a sensor to the water surface. It can show whether a site is approaching an operational or warning threshold, whether the surface is rising quickly, and whether upstream and downstream levels at a structure are changing differently. It is a central input to many water-management procedures. However, a water level does not directly establish the velocity distribution, discharge, or local flow pattern in a channel.
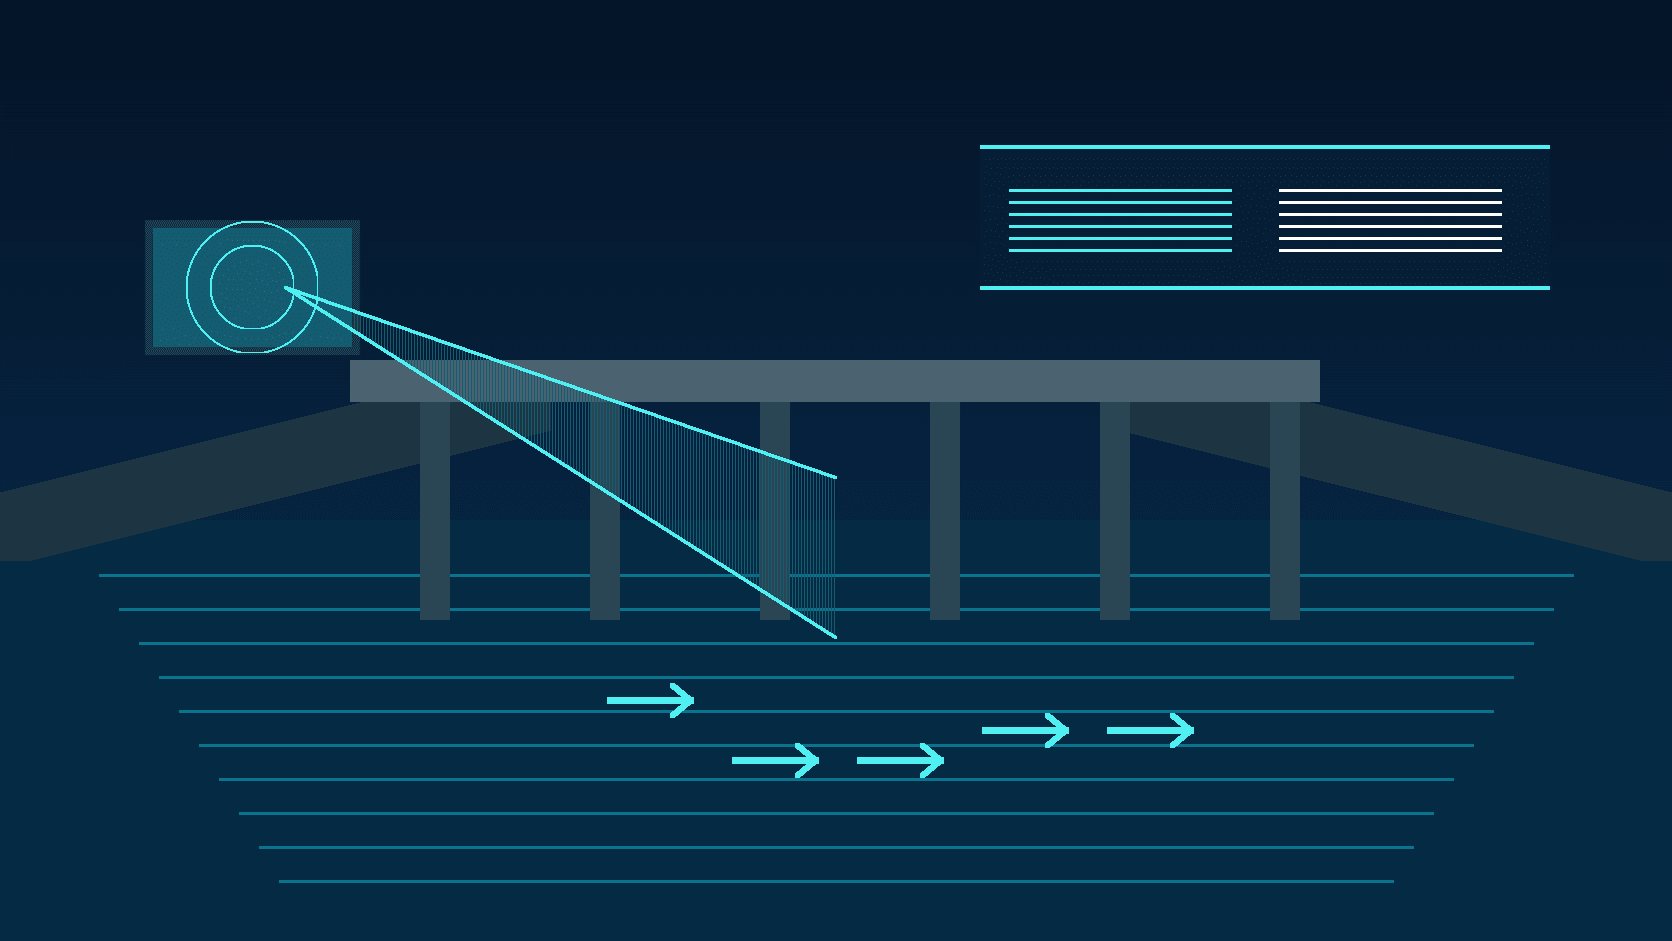
Velocity describes water movement at the location and according to the averaging method defined by the instrument and project. A non-contact radar velocity meter can observe surface-flow velocity in suitable geometry without placing a sensing element into the water. That can reduce exposure to debris, sediment, and high-flow damage. Its result can help reveal a strengthening inflow, local acceleration, backwater, or the effect of a gate operation. Yet a surface or local velocity observation must not automatically be treated as cross-sectional mean velocity or as a calculated flow rate without site-specific validation.
| Measurement | Primary question | Limitation when viewed alone | Benefit of joint interpretation | | --- | --- | --- | --- | | Water level | Where is the water surface and how is it changing? | Does not necessarily show velocity, discharge, or local hydraulics | Provides the stage condition in which velocity changes occur | | Velocity | How is water moving in the approved observation area? | Can be affected by geometry, surface conditions, and data quality | Helps distinguish the hydraulic response behind a level change | | Combined trend | How is the level–velocity relationship behaving? | Requires synchronized, quality-controlled records | Supports more focused verification, warning, and maintenance decisions |
Why the same level can occur with different velocities
The relationship between stage and velocity is not permanently fixed. In natural channels it can vary with cross-section shape, bed roughness, bends, tributary inflow, sediment deposition or scour, downstream backwater, and tidal influence. In urban drainage channels, pump and gate operations, culvert restrictions, blockage, maintenance work, and temporary construction can also change conditions.
During a rainfall event, a faster upstream inflow may first appear as increasing velocity and then as a rising level. A downstream gate closure or tide may raise water level while reducing local velocity. Conversely, a sharp velocity change with little level movement may be associated with a controlled structure, a local obstruction, wind-driven surface conditions, or a measurement issue. The observations are evidence that needs context; they are not a substitute for hydraulic assessment, approved emergency procedures, or field confirmation.
This distinction is especially important for alerts. A rule that reacts to one threshold alone may be useful as a simple safeguard, but it may generate ambiguous events. A joint approach can ask better questions: Is the level still rising? Are consecutive velocity samples valid? Is the station reporting low battery, lost communication, or an invalid-measurement status? Is there a known gate operation or tide condition? The answer to those questions should influence investigation priority, not be hidden behind a single “normal” or “alarm” label.
Establish common station identity, reference, and time
Before comparing two measurements, define their meaning. The level installation needs an agreed datum, mounting reference, range, unit, and method for periodic verification against a staff gauge or other reference. The velocity installation needs a defined observation area, direction convention, mounting height, viewing angle, obstructions, and output averaging interval. Specific mounting distance, angle, power, grounding, and communications requirements must follow the applicable equipment manual and approved project design.
Time is just as important as geometry. Each observation should retain at least the device sample time, gateway receipt time, and platform ingestion time. If records are buffered during a communications outage, they should retain their original sample times and receive a delayed-transmission or quality flag. Otherwise, a recovered backlog can be mistaken for a new hydraulic event. For a station using joint alerts, the clock source, sampling interval, aggregation interval, and upload interval should be checked for both instruments.
A practical station data dictionary should record:
- Level datum, unit, valid range, and under-range or over-range behavior.
- Velocity observation location, direction convention, averaging window, unit, and validity conditions.
- Sampling, upload, backfill, and time-synchronization rules.
- Separate codes for invalid data, communications loss, maintenance, low power, and manual entries.
- The relationship between the monitoring cross-section and nearby structures, rain gauges, gates, or upstream stations.
Deploy for the hydraulic question, not only for signal availability
A level sensor should be located where its reading represents the monitored reach and can be checked safely. Avoid locations dominated by localized turbulence, direct impact, persistent debris accumulation, or a changing reference that cannot be verified. A radar velocity meter requires a clear, suitable view of the intended water surface and installation geometry appropriate to the device and site. Bridge members, rails, vegetation, fixed debris, non-target water, and temporary work can compromise the useful observation area.
Commissioning should test whether trends are plausible under known conditions rather than merely confirming that numerical data appear. Retain synchronized records of level, velocity, site photographs, gate position where relevant, rainfall, manual observations, and maintenance work. At a wide shallow reach, bend, backwater zone, or pier-constrained bridge opening, define whether the velocity signal is intended for local trend monitoring, comparative analysis, or a separately validated calculation. That declaration prevents later users from assigning more certainty to the number than the installation supports.
Design alerts as a managed response process
A useful alert design separates measurement conditions from equipment-health conditions. It may define level thresholds, velocity thresholds, rates of change, data-validity gates, persistence periods, suppression rules, and recovery criteria. For example, a level above an attention threshold and continuing to rise may prompt a routine inspection. Consecutive valid samples showing both a rapidly rising level and increased velocity may justify a higher-priority review under the approved flood plan. A communications outage, low supply voltage, or invalid echo should be visible as a distinct device event, not silently represented as a stable water condition.
| Observed condition | Possible interpretation | Appropriate engineering response | | --- | --- | --- | | Level and velocity both rise persistently | Strengthening upstream inflow or a developing runoff event | Check rainfall, upstream stations, and site evidence; follow escalation procedure | | Level rises while local velocity falls | Downstream control, backwater, tide, or local ponding | Review gate, tide, and downstream conditions before classifying risk | | Abrupt velocity shift with stable level | Structure operation, obstruction, surface disturbance, or quality issue | Check quality status, site changes, and instrument viewing area | | Numerical change with invalid or offline status | Instrument, power, communications, or configuration problem | Investigate the measurement chain before using the value operationally |
Every rule should have an owner, acknowledgment path, escalation threshold, and closure evidence. A single outlier can result from short-lived surface disturbance, a temporary obstruction, or network behavior. In the opposite direction, a station being offline is not proof that the river is safe. Retaining raw observations, quality flags, rule versions, and operator notes makes post-event review possible.
Protect long-term comparability
The greatest value of a station is usually its record over time. The platform should make data completeness, reporting delay, valid-data proportion, power state, communications health, and maintenance events visible alongside the hydraulic trend. Cleaning, re-aiming, firmware updates, datum checks, channel clearing, and cross-section work should be recorded. Those activities may explain a step change that would otherwise be attributed incorrectly to the river.
Where a project intends to calculate discharge from level and velocity, qualified hydrological and engineering personnel should establish and validate the method using measured cross-sections, flow observations, model assumptions, and uncertainty analysis. Bed movement, vegetation, construction, and extreme events can change the relationship. Continuous sensors produce valuable evidence, but they do not remove the need for field measurements, periodic review, and a documented statement of model applicability.
Conclusion
Water level shows the height of the water surface; velocity shows its movement. Monitored together within a common reference, time, and quality framework, they provide a more complete view of river conditions. Clear measurement boundaries, site-appropriate deployment, auditable data quality, and alerts tied to approved operating procedures are what turn the two signals into practical support for safe river operations.